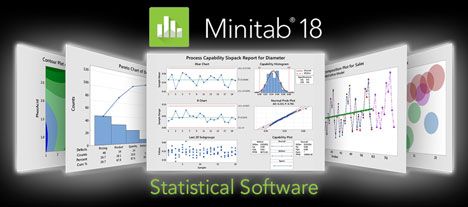
MINITAB Statistical Software is the ideal package for Six Sigma and other quality improvement projects. From Statistical Process Control to Design of Experiments, it offers you the methods you need to implement every phase of your quality project, along with features like StatGuide and ReportPad that help you understand and communicate your results.
No package is more accurate, reliable, or easy to use. In addition to more statistical power than our previous release, MINITAB offers many exciting new features such as: A powerful new graphics engine that delivers engaging results that offer tremendous insight into your data An effortless method to create, edit, and update graphs The ability to customize your menus and toolbars so you can conveniently access the methods you use most.
* New or Improved
Assistant
Measurement Systems Analysis
Capability Analysis
Graphical Analysis
Hypothesis Tests
Regression
DOE
Control Charts
Basic Statistics
Descriptive statistics
One-sample Z-test, one- and two-sample t-tests, paired t-test
One and two proportions tests
One- and two-sample Poisson rate tests
One and two variances tests
Correlation and covariance
Normality test
Outlier test
Poisson goodness-of-fit test
Graphics
Easily create professional-looking graphics
Scatterplots, matrix plots, boxplots, dotplots, histograms, charts, time series plots, etc.
Bubble plot
Contour and rotating 3D plots
Probability and probability distribution plots
Edit attributes: axes, labels, reference lines, etc.
Interactively recreate custom graphs with new data
Easily place multiple graphs on one page
Automatically update graphs as data change
Brush graphs to explore points of interest
Export: TIF, JPEG, PNG, BMP, GIF, EMF
Regression
Linear regression
Binary, ordinal and nominal logistic regression
Nonlinear regression
Stability studies
Orthogonal regression
Partial least squares
Poisson regression
Plots: residual, factorial, contour, surface, etc.
Stepwise and best subsets
Response prediction and optimization
Analysis of Variance
ANOVA
General Linear Model
MANOVA
Multiple comparisons
Response prediction and optimization
Test for equal variances
Plots: residual, factorial, contour, surface, etc.
Analysis of means
Statistical Process Control
Run chart
Pareto chart
Cause-and-effect diagram
Variables control charts: XBar, R, S, XBar-R, XBar-S, I, MR, I-MR, I-MR-R/S, zone, Z-MR
Attributes control charts: P, NP, C, U, Laney P’ and U’
Time-weighted control charts: MA, EWMA, CUSUM
Multivariate control charts: T2, generalized variance, MEWMA
Rare events charts: G and T
Historical/shift-in-process charts
Box-Cox and Johnson transformations
Individual distribution identification
Process capability: normal, non-normal, attribute, batch
Process capability for multiple variables
Process Capability SixpackTM
Tolerance intervals
Acceptance sampling and OC curves
Measurement Systems Analysis
Data collection worksheets
Gage R&R Crossed: ANOVA and Xbar-R methods
Gage R&R Nested
Gage R&R Expanded
Misclassification probabilities
Gage run chart
Gage linearity and bias
Type 1 Gage Study
Attribute Gage Study – AIAG analytic method
Attribute agreement analysis
Design of Experiments
Two-level factorial designs
Split-plot designs
General factorial designs
Plackett-Burman designs
Response surface designs
Mixture designs
D-optimal and distance-based designs
Taguchi designs
User-specified designs
Analyze variability for factorial designs
Botched runs
Effects plots: normal, half-normal, Pareto
Response prediction and optimization
Plots: residual, main effects, interaction, cube, contour, surface, wireframe
Reliability/Survival
Parametric and nonparametric distribution analysis
Goodness-of-fit measures
ML and least squares estimates
Exact failure, right-, left-, and interval-censored data
Accelerated life testing
Regression with life data
Reliability test plans
Threshold parameter distributions
Repairable systems
Multiple failure modes
Probit analysis
Weibayes analysis
Hypothesis tests on distribution parameters
Plots: distribution, probability, hazard, survival
Warranty analysis
Power and Sample Size
Sample size for estimation
Sample size for tolerance intervals
One-sample Z, one- and two-sample t
Paired t
One and two proportions
One- and two-sample Poisson rates
One and two variances
Equivalence tests
One-Way ANOVA
Two-level, Plackett-Burman and general full factorial designs
Power curves
Multivariate
Principal components analysis
Factor analysis
Discriminant analysis
Cluster analysis
Correspondence analysis
Item analysis and Cronbach’s alpha
Time Series and Forecasting
Time series plots
Trend analysis
Decomposition
Moving average
Exponential smoothing
Winters’ method
Auto-, partial auto-, and cross correlation functions
ARIMA
Nonparametrics
Sign test
Wilcoxon test
Mann-Whitney test
Kruskal-Wallis test
Mood’s median test
Friedman test
Runs test
Equivalence Tests
One- and two-sample, paired and 2x2 crossover design
Tables
Chi-square, Fisher’s exact, and other tests
Chi-square goodness-of-fit test
Tally individual variables
Simulations and Distributions
Random number generator
Density, cumulative distribution, and inverse cumulative distribution functions
Random sampling
Macros and Customization
Customizable menus and toolbars
Extensive preferences and user profiles


0 Response to this entry.